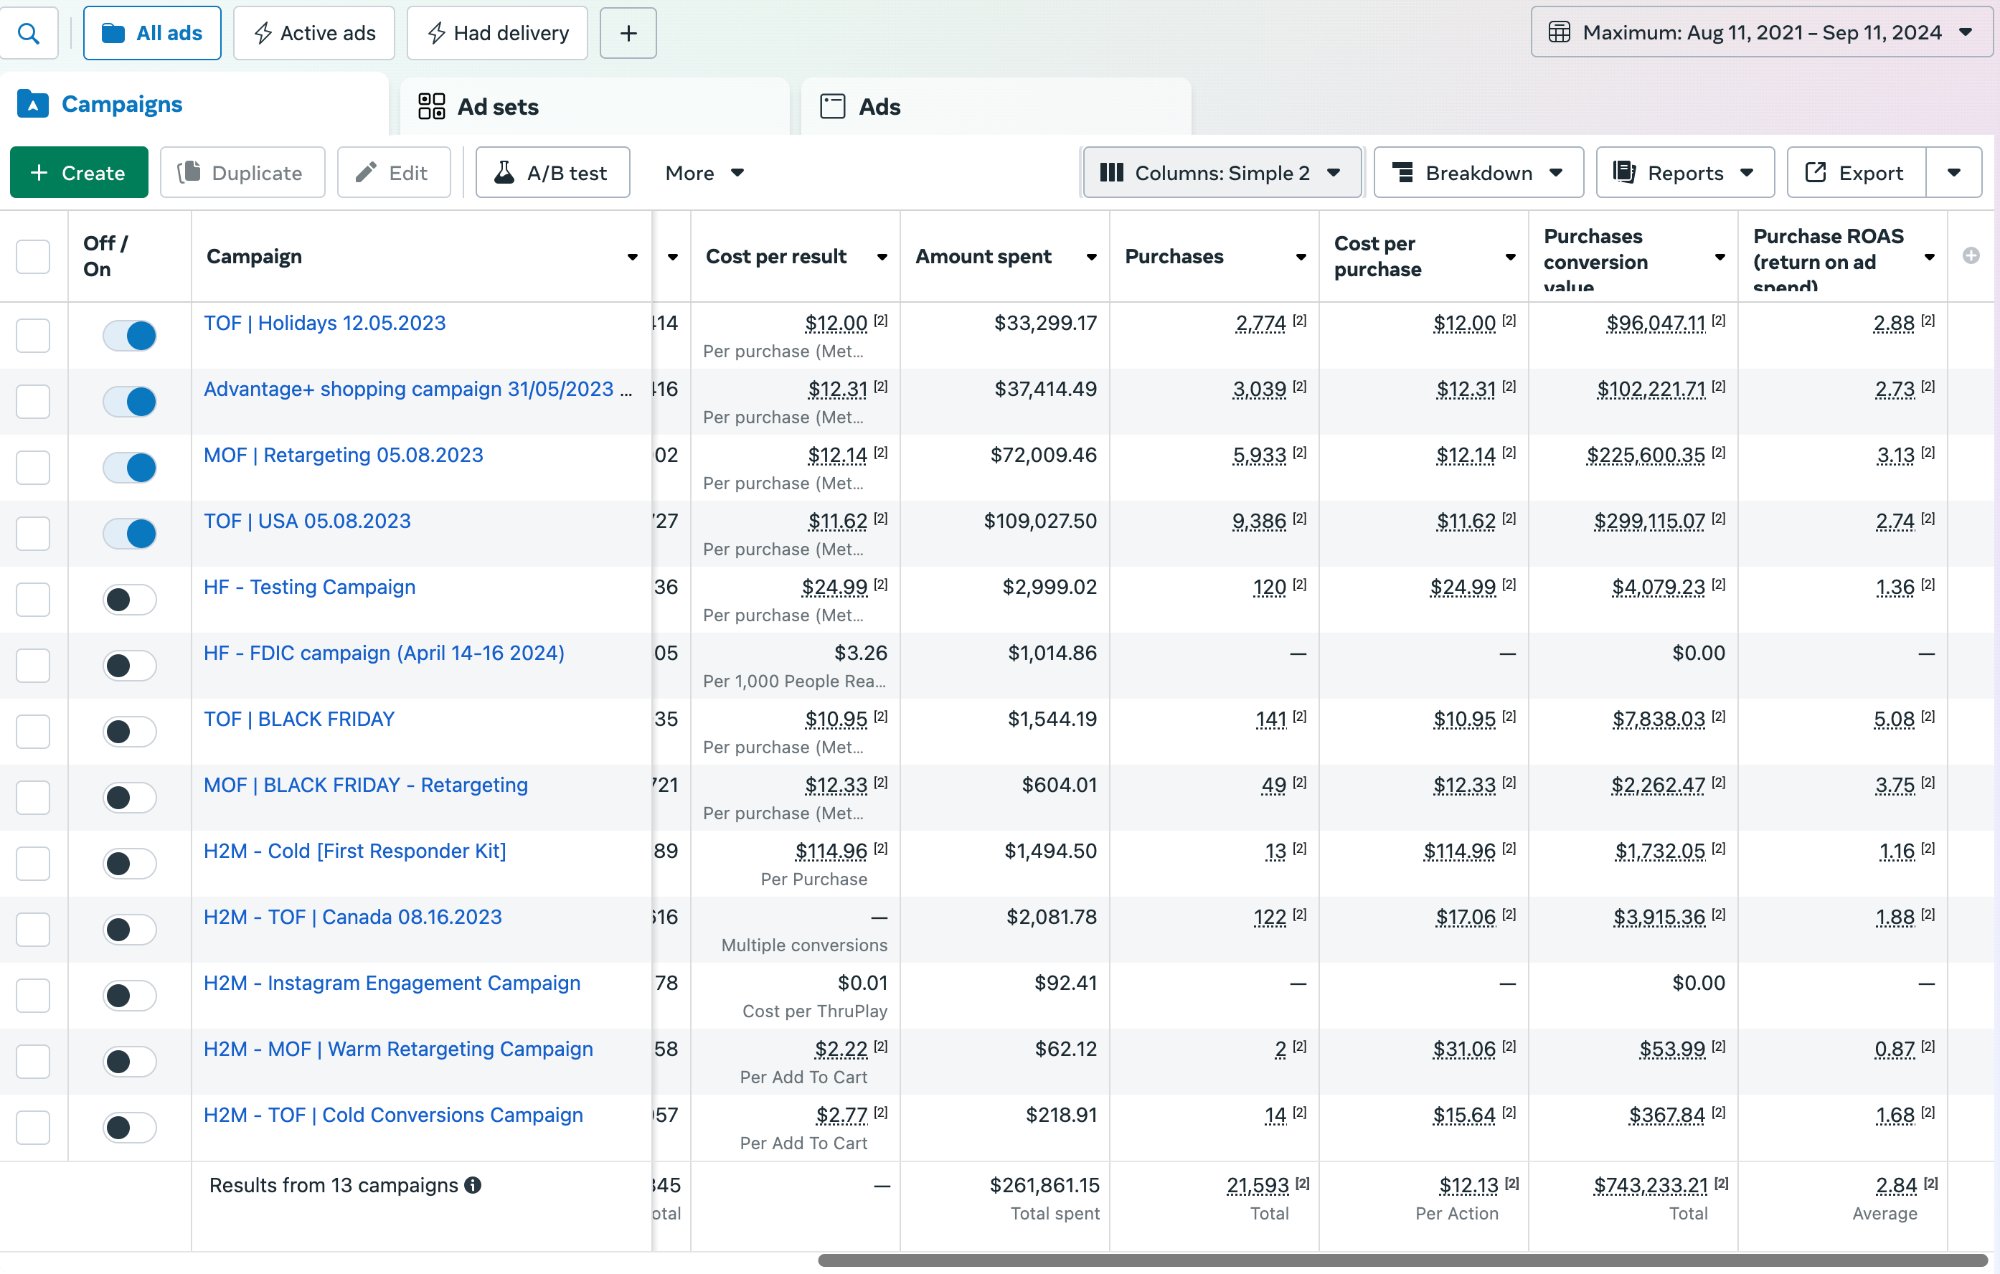
Meta · anonymous accountAug 11, 2021–Sep 11, 2024
21,593 purchases
2.84x purchase ROAS · $261,861.15 spent
 View screenshot ↗
These reports show historical account performance from past engagements. Each screenshot retains its own reporting period and platform metrics. Account and client identities are withheld. The reports are examples of past work, with attribution limits explained below; they are not a forecast for a new engagement.
2.84x purchase ROAS · $261,861.15 spent
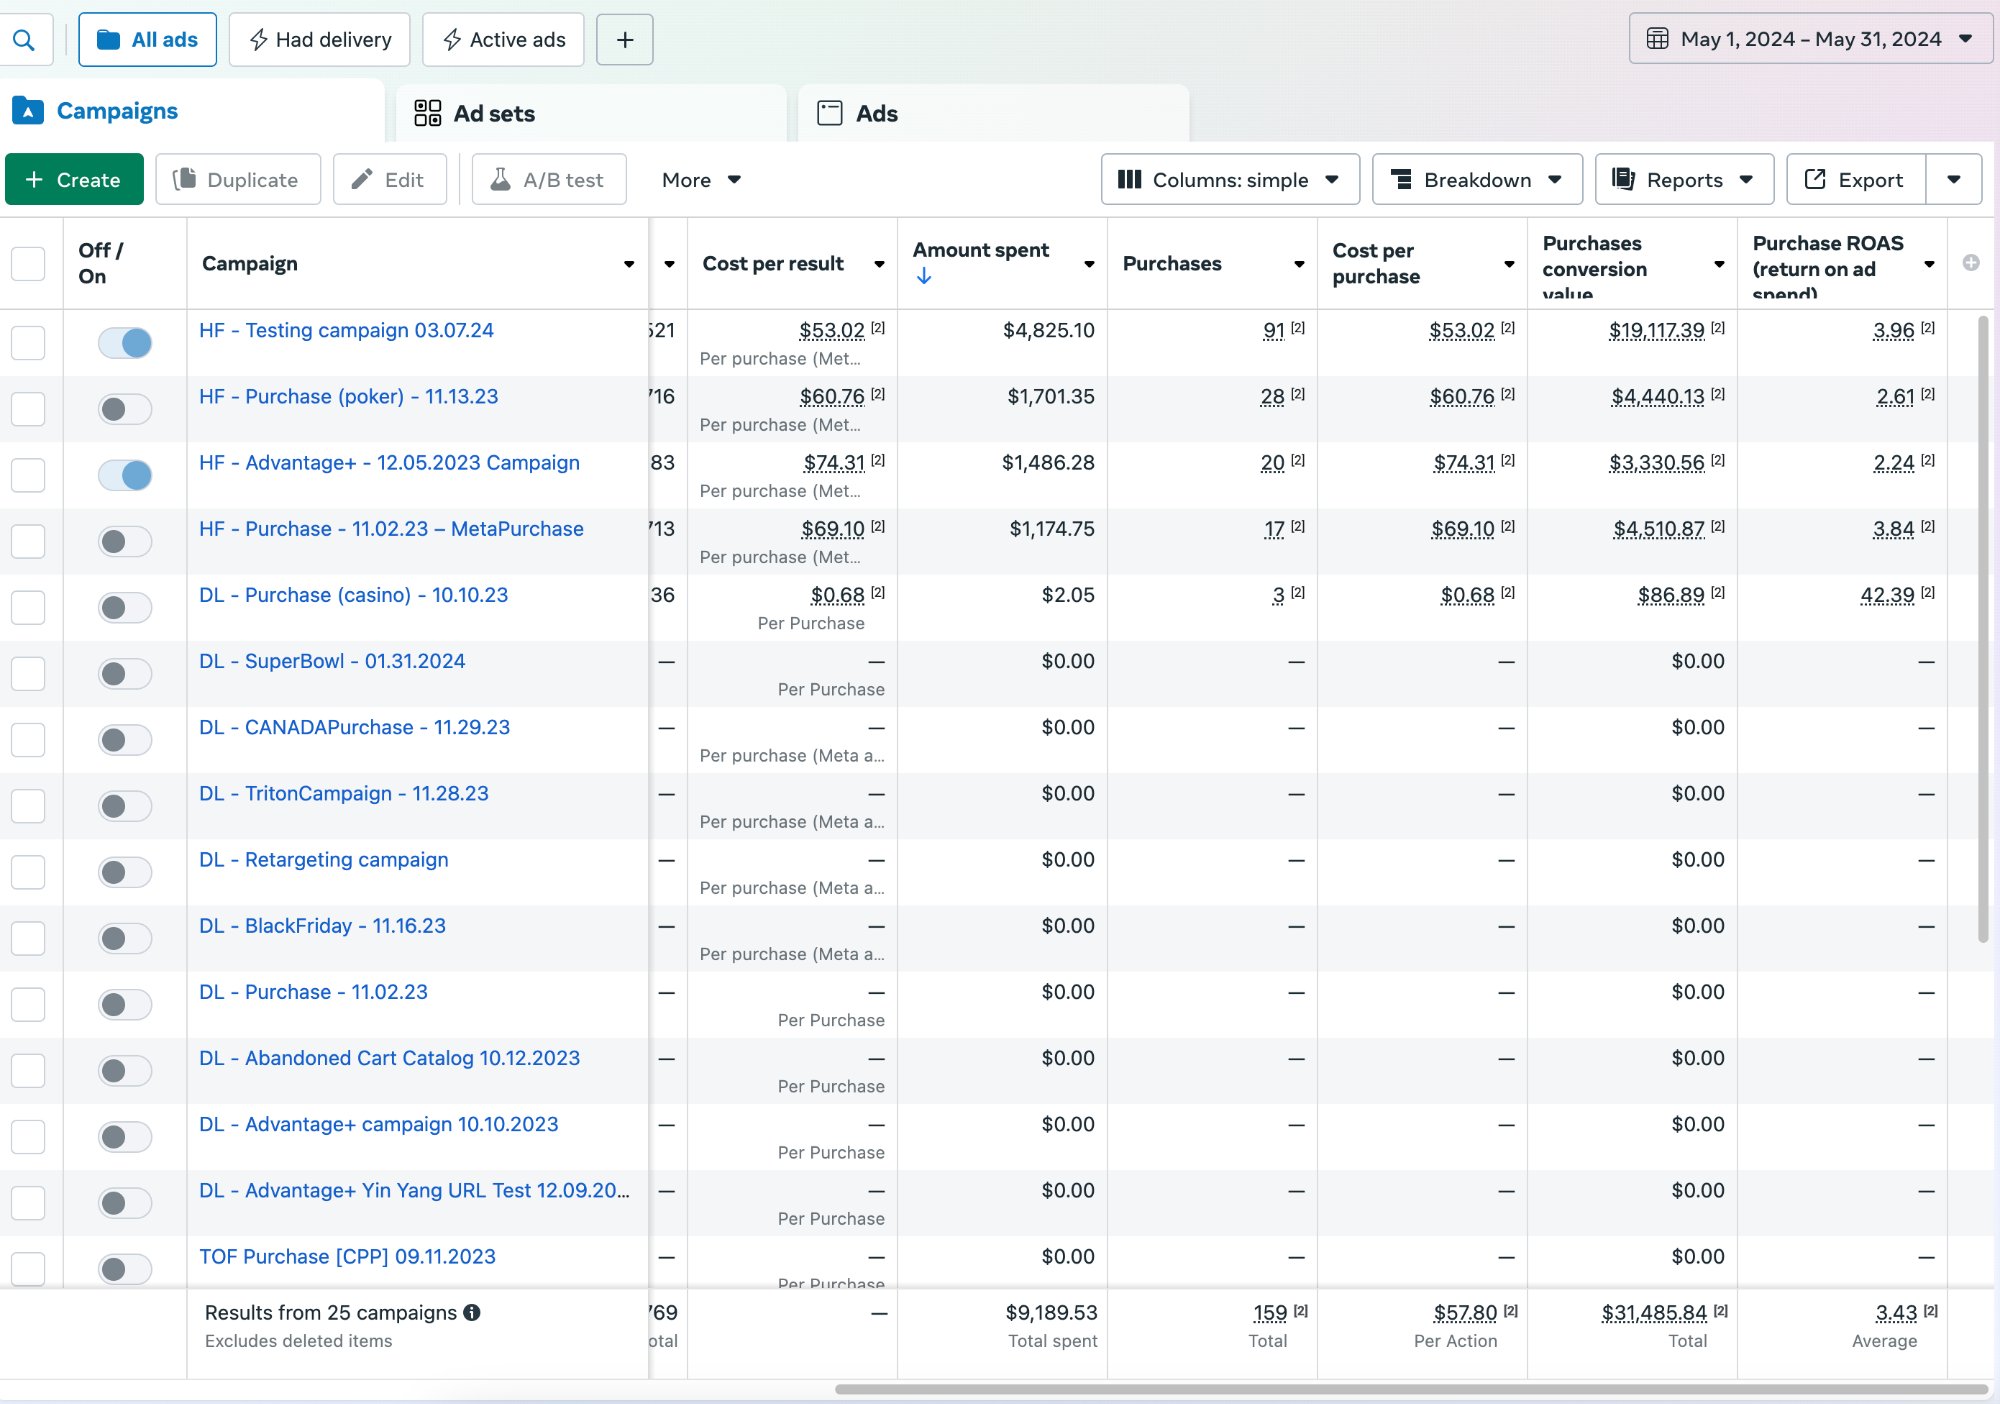
View screenshot ↗159 purchases · $9,189.53 spent
 View screenshot ↗
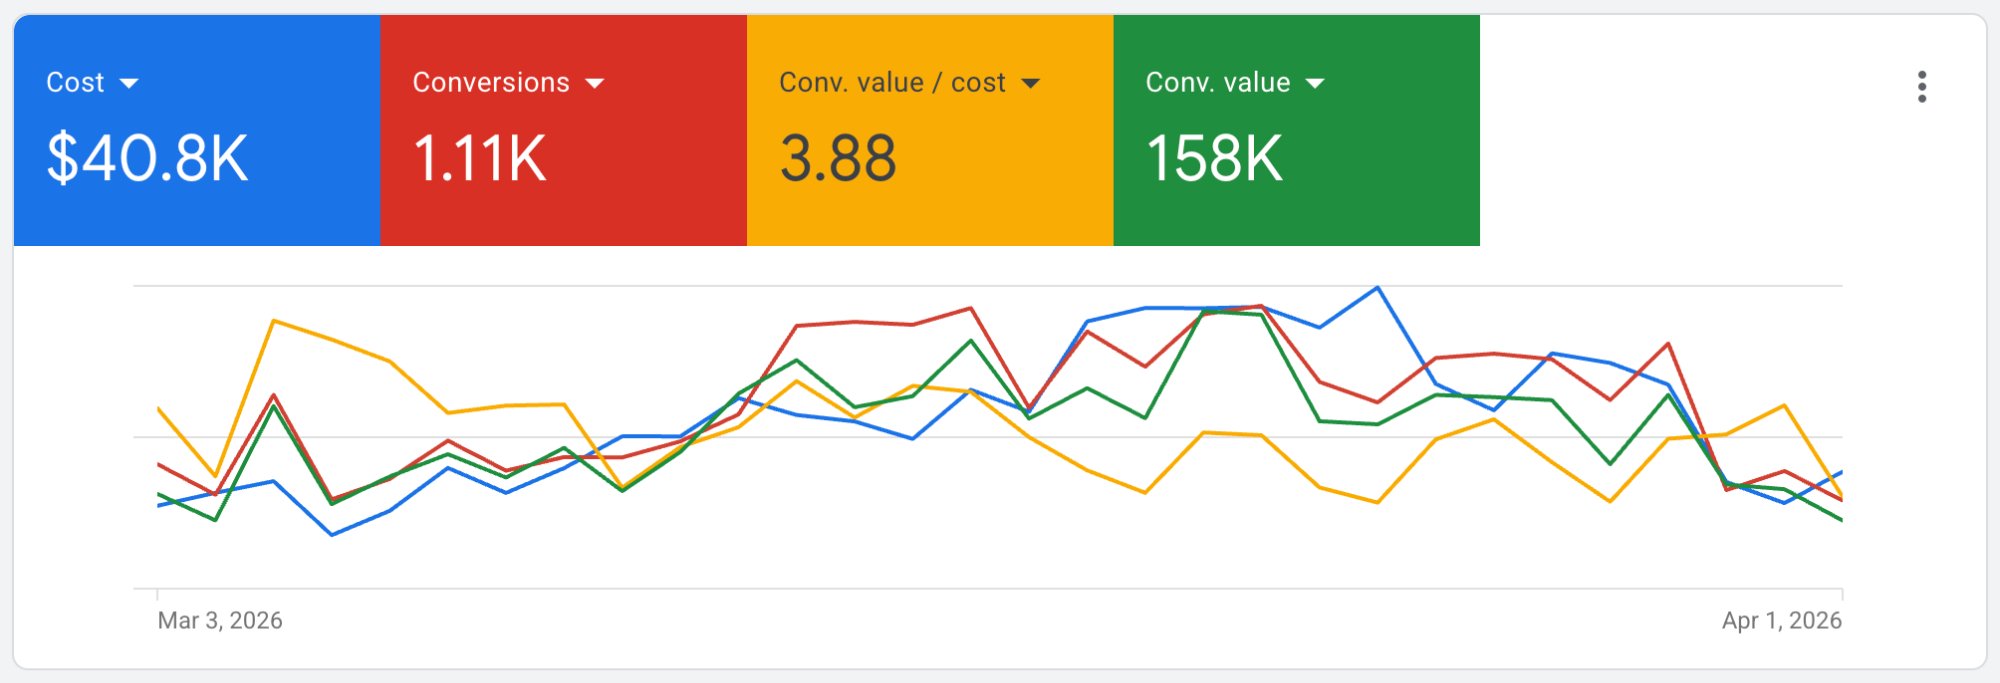
1.11K conversions · $40.8K cost
 View screenshot ↗
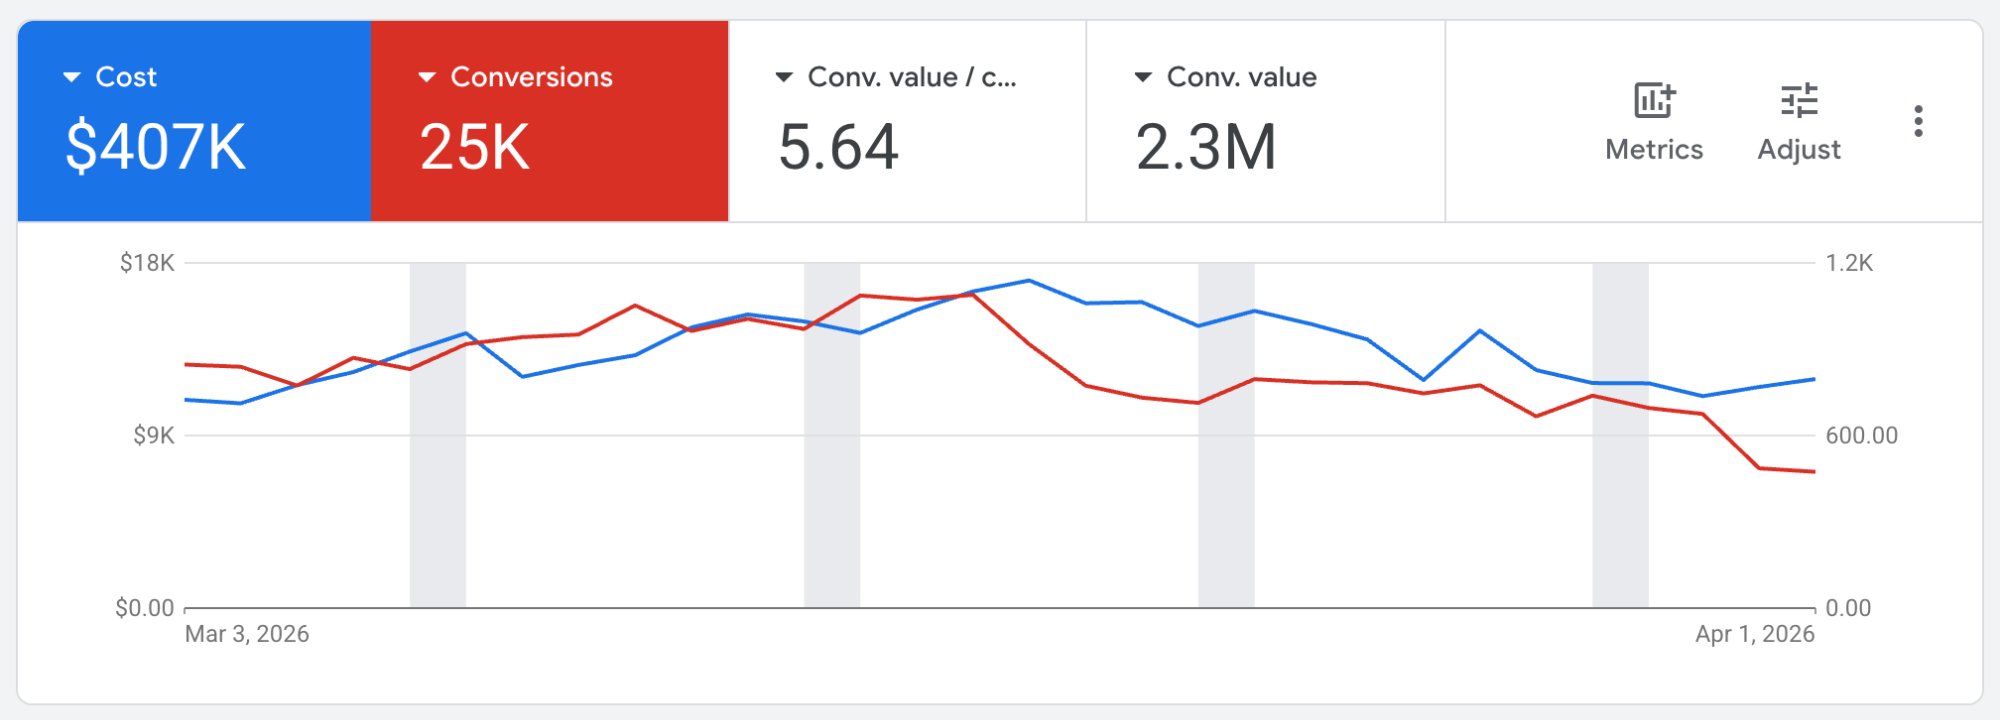
25K conversions · $407K cost
 View screenshot ↗
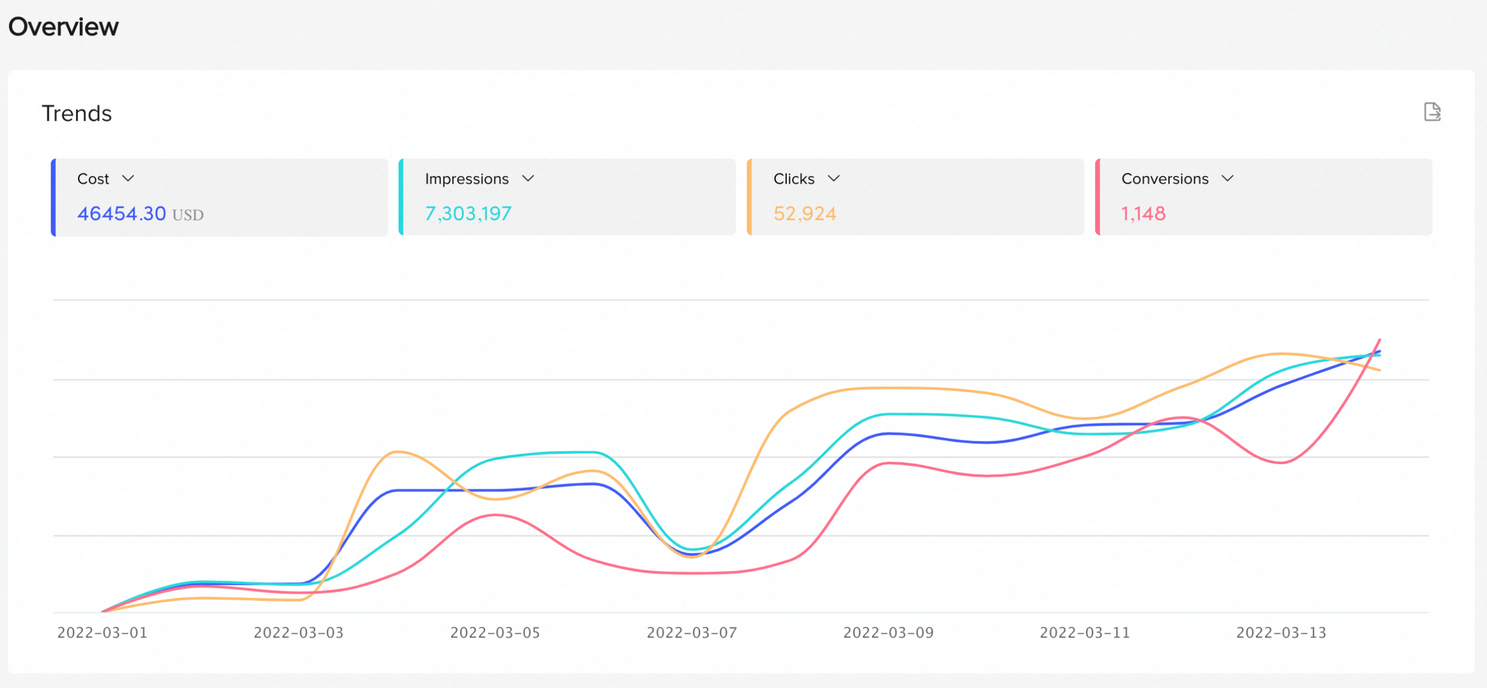
$46,454.30 cost · 7.3M impressions
 View screenshot ↗
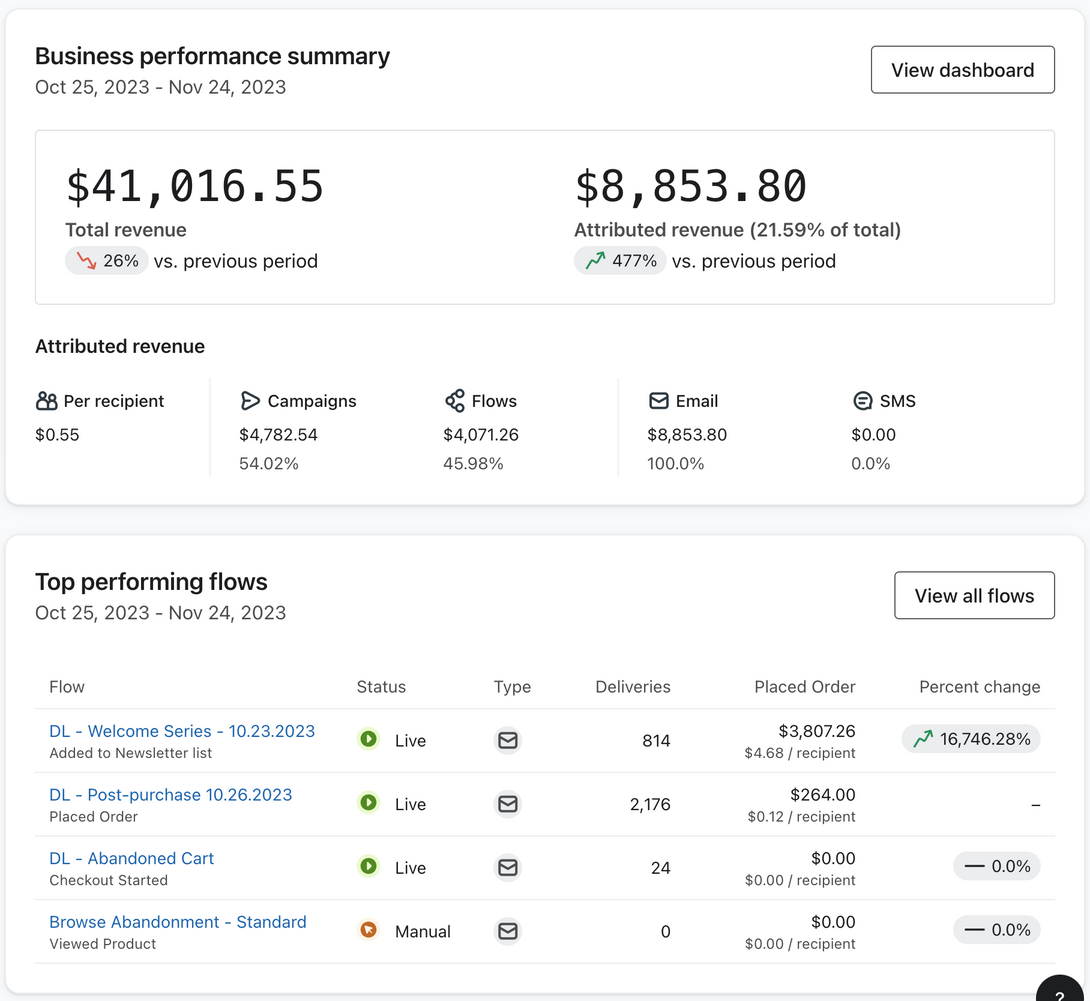
$8,853.80 attributed · $4,071.26 flows · $4,782.54 campaigns
 View screenshot ↗
Reporting windows, platforms and attribution models differ. The reports are not a portfolio average and should not be added together. A platform conversion can be a different action from a purchase. Google’s conversion value / cost depends on the conversion values configured in the account. Email-attributed revenue is not the same as incremental revenue caused by email.
A complete evaluation pairs these reports with business context, costs, account scope and the measurement method. The interactive dashboards on the service pages are separate illustrative demonstrations.
Explore paid media management, compare current package pricing, or discuss your goals and available data.